








Power BI

Enterprise
Analytics Portal.

Beyond BI integration: the common layer between your users and your BI & analytics platforms.

Keep your existing BI tools. Unify them under one user experience and one security model.

Replace your BI tools? No. Unify them. · 8 BI platforms · Cloud & On-Premise · SSO · Governance · AI Analytics

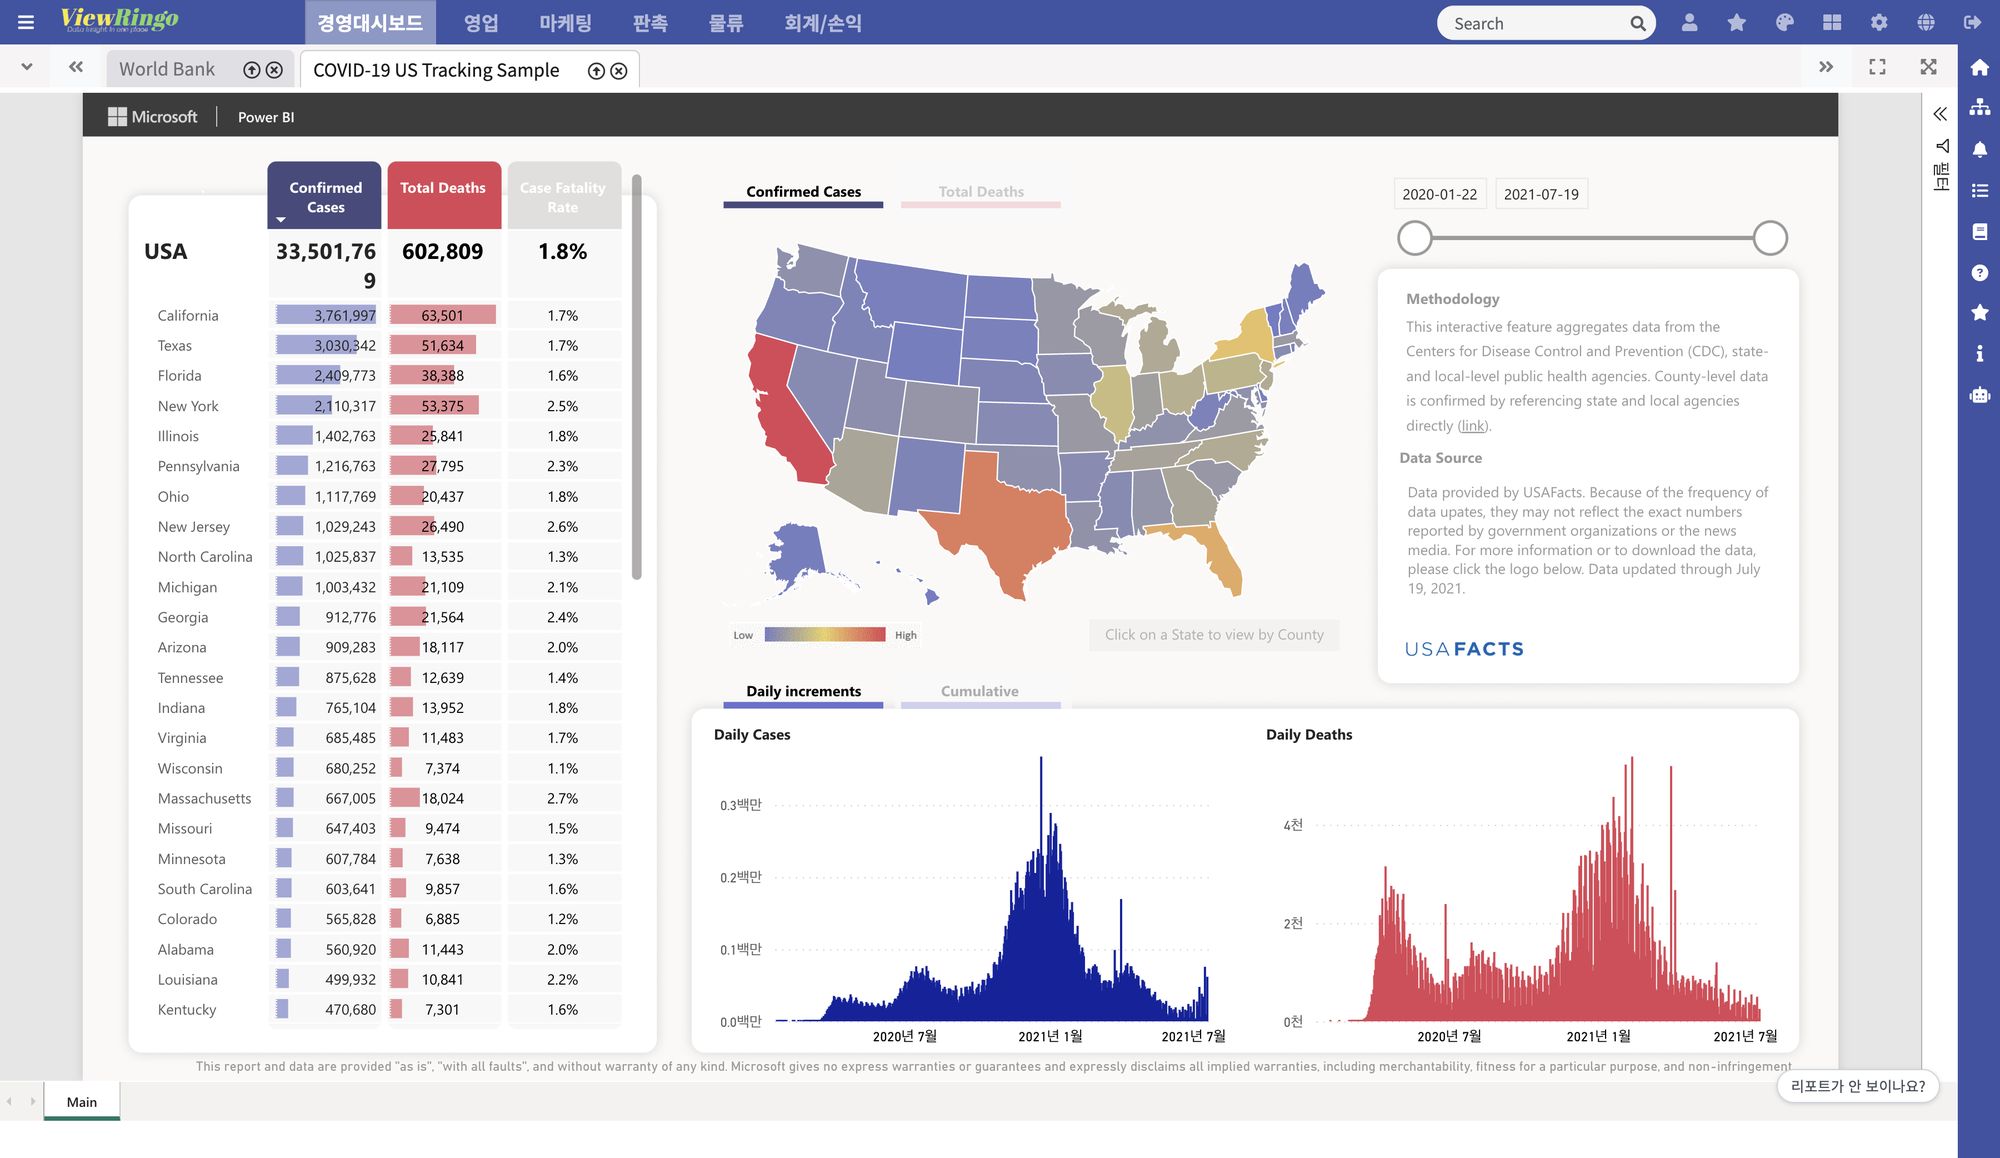
Power BI sales dashboard opened in the ViewRingo portal Tableau profitability overview opened in the ViewRingo portal Qlik Sense sales analysis sheet opened in the ViewRingo portal Apache Superset population dashboard opened in the ViewRingo portal Strategy store performance dashboard opened in the ViewRingo portal Databricks AI/BI dashboard opened in the ViewRingo portal Power BI Report Server paginated report opened in the ViewRingo portal
8 BI platformsUnified in one portal
Cloud · On-PremiseBoth environments supported
Single sign-onOne permission model in the portal
AI analytics built inGenie · Data Assistant

Why an Enterprise Analytics Portal, now

BI tools multiply department by department, while users and admins shuttle between them repeating the same work.

Tools keep multiplying

Department- and affiliate-level purchases pile up until several BI tools coexist in one company.

Permissions fragment

Each tool has its own accounts and permission model, so granting one person the same scope is done over and over.

Provenance disappears

There is no way to answer which table a report figure came from, or what breaks if it changes.

86%of organizations use two or more BI toolsForrester survey, cited by Zoho
96%expect better results from natural-language data queriesSalesforce survey incl. 500 Korean companies, 2026

Don't cut the tools. Unify the portal.

A common layer on top of your existing BI

Add another BI tool and the user experience, authentication, permissions, menus and logs stay exactly the same.

Your BI as it is, in one portal

Power BI · Tableau · Qlik Sense · Superset · Longview · Strategy · Databricks · PBIRS on one URL, one screen.

One authentication, one set of permissions

Policy-based permission groups unify access, and every access is written to the activity log.

AI analytics inside the portal

Databricks Genie and Data Assistant run inside the portal's permission model.

AS-IS

Scattered BI assets

A different address, UI, account and permissions per tool

TO-BE

ViewRingo Enterprise Analytics Portal

Tableau report opened in a ViewRingo portal tab

One address · one UI · one authentication and permission model

Product overview video

A five-minute walkthrough of the ViewRingo portal's core features, recorded on the real product.

  • Reports from 8 BI platforms in one portal — Superset · Tableau · Power BI · Qlik · PBIRS · Databricks · Strategy · Longview
  • Role-based permissions, linked to your authentication — menu and report access control, enterprise authentication and on-premises deployment
  • Unified search, favorites and personalization — personal start pages, announcements, boards, business glossary and online help
  • Usage monitoring — report usage, access and performance logs
  • AI inside the portal — report summaries (Data Assistant) and Databricks Genie agents

Watch on YouTube · 5:16

8 supported BI platforms

Each vendor's official embedding and authentication is used as-is, so existing report permissions and audit trails are preserved.

Power BI
Cloud
Tableau
CloudOn-Prem
Qlik Sense
Cloud
Apache Superset
On-Prem
Longview
On-Prem
Strategy
CloudOn-Prem
DatabricksNEW
Cloud
Power BI Report ServerNEW
On-Prem

Strategy is the current name of the platform formerly known as Strategy One / MicroStrategy ONE. For on-premises integrations, confirm the target version and Strategy Support Lifecycle in advance.

Two new additions

For reports that cannot leave the data center, and users who cannot be given accounts.

Power BI Report Server report opened in a ViewRingo portal tab

Power BI Report ServerNEW

Unify BI without a cloud migration — even in air-gapped, data-sovereignty environments.

  • PBIX and RDL together — interactive and paginated reports detected automatically
  • Existing AD permissions as-is — Windows integrated authentication (Kerberos · NTLM)
  • Hierarchical tree registration — PBIRS folder structure mirrored in the portal menu
Databricks AI/BI dashboard opened in the ViewRingo portal

Databricks AI/BI DashboardNEW

View dashboards right in the portal — no Databricks account needed.

  • No account required — External Viewer embedding
  • Per-user tokens — only scope-limited tokens reach the browser
  • Automatic admin mapping — published dashboards listed automatically

AI analytics that run inside the portal

Natural-language queries and on-screen summaries, delivered inside the portal's authentication and permission model.

Databricks Genie Agents

Ask in plain language and get the answer with its SQL and charts.

  • Two modes — quick answers or deep analysis
  • Traceable evidence — generated SQL · analysis steps · charts
  • User permissions preserved — only within the user's own scope

ViewRingo Data Assistant

Summarize the screen you're looking at and ask your data questions in plain language.

  • Screen summary — one click; reports outside your permissions are never rendered
  • NL2SQL — MSSQL · PostgreSQL · Oracle
  • Server-side only — every request passes through the portal server

Semantic layer

Accuracy comes from reviewed context, not from the model.

  • Human-reviewed semantics — descriptions · synonyms · metrics · relationships
  • Golden-set regression tests — checked on a schedule for answers that flip
  • SQL validated before it runs — missing columns and syntax errors blocked up front

Where the numbers come from, and who used them

Data lineageNEW

Where this number came from and what breaks if it changes — across BI tools, on one screen.

ReportSales Overview ChartMonthly sales trend DatasetSALES_MART TableSL_TRX ColumnNET_AMT

Collected from: Superset · Tableau · Qlik · Power BI · Databricks · PBIRS (Longview excluded by design)

Activity log · auditNEW

Who viewed which report, and when — as metrics and as evidence.

  • Usage KPIs per tool — usage trends and share of views
  • Unused reports identified — retire assets nobody opens
  • Excel audit export — activity logs as audit evidence

Why teams choose ViewRingo

8 BI tools, one portalPower BI · Tableau · Qlik · Superset · Longview · Strategy · Databricks · PBIRS
Existing investment protectedConnect without replacing BI; new tools join the same way
One UXThe same navigation, menus and sharing across every tool
Unified governancePolicy-based permission groups and audit logs
Enterprise AI AnalyticsGenie and Data Assistant inside the portal
Cloud and on-premise, unifiedSaaS BI and on-premise report servers together

"Can I ask about a Tableau report and a Power BI report in one question?"

Every vendor-built AI answers no — not for lack of capability, but because of where its boundaries are drawn. ViewRingo is different.

Across tools

Query reports from 8 BI tools at once

Inside closed networks

Runs on-premise and in air-gapped networks

You choose the model

Connect the LLM you already own

Case studies

In both cases users enter via SSO from the corporate Enterprise Portal and view reports through ViewRingo's menus and permissions.

Company H · Azure

Single Power BI portal

Started with one BI tool; adding another is just a menu registration.

Company L · On-Premise

Tableau + Longview unified portal

One portal metadata DB (SQL Server or PostgreSQL) unified the menus and permissions of both tools.

Contact us

Tell us about your environment and the BI tools you use, and we'll reply with a proposed configuration.

ViewRingo Enterprise Analytics Portal
Product Introduction v2.3 · 2026.09

Or email us directly: sales@viewringo.com